
As the Covid-19 Pandemic enters its third year it continues to be a dominant force in the global economy, causing new waves of infection and varying levels of restrictions around the globe. However, global growth staged a recovery in 2021, buoyed by vaccine rollouts, ultra-easy monetary policy, fiscal stimulus, and the unleashing of pent-up consumer demand.
Key Highlights:
- Rapid vaccine deployment helped reduce case levels and accelerate recovery earlier in the year
- Supply chain issues and strong consumer demand sent inflation soaring to 30+ year highs
- Reopening tailwinds sent stocks to new highs, despite new waves of the virus and surging inflation
- New Covid variants and hawkish Fed policy presented potential headwinds for markets by year-end
The US economy is expected to grow 5% to 6% in 2021, having surpassed the pre-Covid GDP level by the 2nd quarter of the year. While not all countries matched the pace of the US recovery, most also saw well above average growth for the calendar year. Growth tailwinds lead to double digit gains for most equity markets as well as commodities, with Asia and emerging markets lagging.
Markets faced challenges in 2021 beyond new waves of the virus. Most notable was rapidly rising inflation caused by supply chain bottlenecks and elevated consumer demand. This was acutely felt in the US but was a global phenomenon, with many countries hitting multi-decade highs for year-over-year inflation measures. By year-end the ongoing reaction to inflation by the US Fed and other central banks was top of mind for investors, along with a record wave of Covid infections fueled by the latest variant.
Economic Conditions
Global Economy
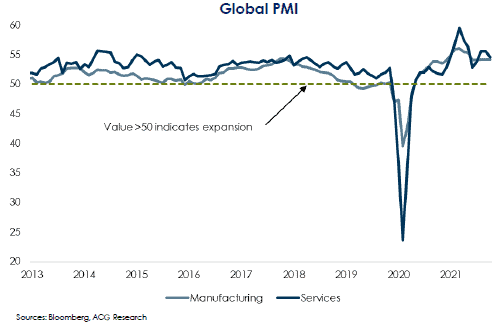
The world began 2021 in the midst of a Covid wave, but with a brightening outlook as vaccines were starting to roll out. Reopening optimism, elevated consumer demand bolstered by fiscal stimulus, and accommodative central banks sustained strong global growth for the year. However, this growth was not always in sync, as some regions dealt with new waves of the virus and others that were among the first to recover became the first to decelerate, notably China.
Pace of vaccine rollouts and size of government responses, both in varying levels of tolerance for lockdowns and fiscal support, played a role in the strength of regional recoveries. Virus surges continue to weigh on growth, yet successive waves have become relatively less disruptive as immunity expands, whether from infection or vaccination, and society adapts to the virus.
The course of growth still greatly depends on Covid and its potential variants, but other risk factors rose to prominence as the year went on, particularly inflation. Nearly every major economy experienced above-trend inflation in 2021 as pandemic shutdowns and labor shortages created problems for supply chains, commodity prices surged, and production couldn’t keep up with high demand. Central banks around the world have begun tightening in response and going forward will need to walk a tightrope between reining in inflation and maintaining growth. Other risk factors to watch include growing geopolitical tensions and the potential for an extended slowdown in China.
US Economy
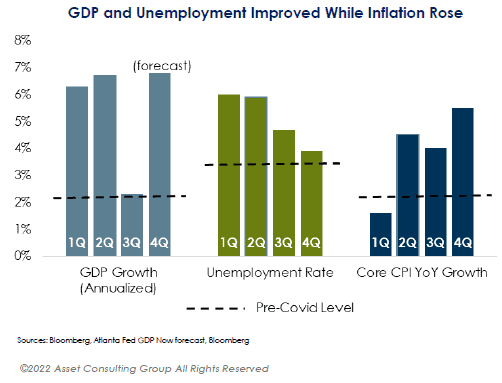
The US economy staged a sharp turnaround from 2020’s recession, as momentum from the 2nd half of 2020 carried into the new year and allowed real GDP to exceed its pre-Covid level in 2Q21. The labor market also experienced rapid growth, with unemployment falling from 6.7% to 3.9% over the course of the year. However, beyond the unemployment figure, much disruption remains as labor force participation sits well below pre-pandemic levels and worker shortages are widespread.
US inflation began a sharp upward trend by the 2nd quarter, with the initial elevated levels downplayed as a result of base effects and short-lived supply chain issues. However, it proved more persistent than anticipated, and core CPI growth rose to 5.5% by the end of the year for the largest rise since 1991. Under the Federal Reserve’s new policy of “average inflation targeting” and dual mandate to promote full employment, the central bank didn’t move to address inflation until year-end, announcing a tapering timeline in November before accelerating that timeline in December and positioning itself for three rate hikes in 2022.
Covid waves have been a backdrop for much of the year, with Delta peaking in late summer and Omicron emerging to end the year. That combined with inflation data has seen consumer sentiment fall back to levels seen in the early pandemic. Nonetheless, consumer behavior has supported the economic recovery with spending growth outpacing inflation. Consumers remain well positioned heading into 2022, with rising wages, near-record job openings, and high levels of accumulated savings as US growth is shifting from rapid post-pandemic rebound to more muted, but still strong, growth.
Broad Asset Class Performance
In Brief:
- 2021 was a strong year for global developed market equities, with the US outperforming international developed markets.
- Bonds generally performed poorly as interest rates rose off pandemic lows, with some exceptions (high yield credit, TIPS…).
- Equity long/short significantly underperformed US equity but performed in-line with non-US developed.
- Commodities and real estate both performed well amid elevated inflation and strong demand from global growth.
Global Equity Update
Global Long-Only Equity
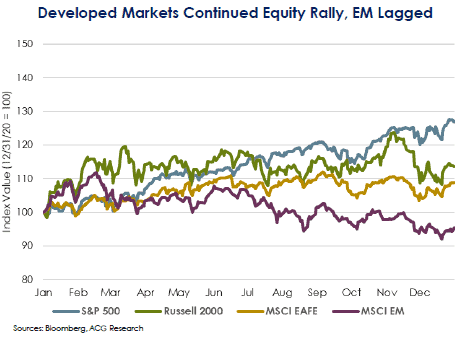
Global equities posted double-digit performance for the third year in a row with a nearly 20% advance in the MSCI ACWI contributing to the annualized three-year return of 21% at the end of 2021. Returns were strong in the first half of the year as vaccine distribution and reopening optimism drove cyclical stocks higher. Concerns over Covid variants, supply chain issues, labor shortages, and inflation drove market volatility later in the year, but many global indexes finished 2021 with mid-single digit returns in the month of December.
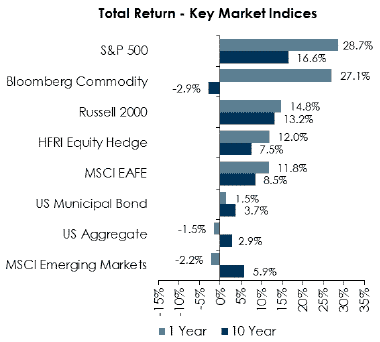
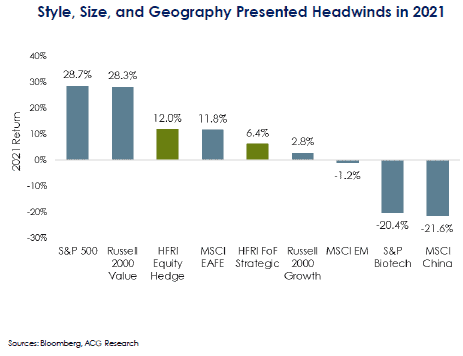
US Equity returns favored Large Caps in 2021, with the S&P 500 doubling the return of the Russell 2000 Small Cap index. Style had less influence on Large Cap performance relative to recent years and the Russell 1000 Value and Growth indexes generated similar annual returns. However, the Small Cap style indexes diverged by over 25% as the Russell 2000 Growth faced significant performance headwinds from its Health Care exposure. Large Cap index concentration increased with the largest 10 holdings comprising 25% of the S&P 500 by year-end, compared to just over 3% in the Russell 2000.
Developed International absolute performance was respectable in 2021, with the MSCI EAFE returning 11%. However, slower economic reopening, limited IT exposure in European indexes, and currency effects muted returns relative to equity markets in the United States. Emerging Markets finished negative, hurt by double-digit losses within Brazil and China. Chinese equities, which comprise over 30% of the MSCI EM index, had a tumultuous 2021 during which its government applied regulatory pressure to various industries and the country’s largest private real estate developer faced significant liquidity issues.
Global Long/Short Equity
After a strong year in 2020, performance for Equity Long/Short managers was challenged in 2021. The meme-stock rally and outperformance of the lowest quality stocks hurt performance in the first half. Fundamentals continued to have minimal impact on stock prices in the second half as markets were more driven by macro-economic concerns about Covid, inflation, and rotations between growth and value. Many managers lamented the disconnect between company performance and stock performance.
Market volatility during 2021 remained above the 20-year average for the majority of the year as Covid variants, supply chain delays, and interest rate speculation kept uncertainty heightened. We anticipate continued volatility to be the norm for 2022. A higher vol environment historically generates opportunities on both the long and short side, benefitting equity long/short managers. Gross exposure started 2021 at a multi-year high but decreased through the year to end near the lowest point in five years. Net exposure, which started the year near a decade high, remained high most of the year. This combination of low gross and high net is a sign that managers are concerned about risk but optimistic about upside opportunity.
Style and size were significant headwinds in 2021 as small growth underperformed small value by 25%. Technology and Health Care (specifically Biotech), which are typically large weights in many equity long/short portfolios, were the most challenged sectors, with Biotech having the largest (negative) dispersion from the rest of healthcare since inception of the indices. The ratio of growth to value exposure has decreased below the historical average for the first time since 2016. European exposure peaked in mid-2021 but remains higher than it has been in a decade. Exposure to China created difficulty due to restrictive regulations, resulting in a decrease in China exposure throughout the year.
Global Private Equity
2021 was an exceptional year for private markets as the Covid effects of 2020 wore off and managers sought to pair robust fundraising with strong liquidity for investors. Beginning with new capital formation, 2021 saw a continuation of managers coming back to market sooner with accelerating fund size increases. Many firms are now raising new funds within 2 to 3 years of their last fundraise, and on average they are increasing in size by at least 60%. This activity is fueled by record-setting performance over the last several years, particularly in US venture capital, which returned 26%annualized for the three years ending 3/31/2021 (vs. 17% for the S&P 500).
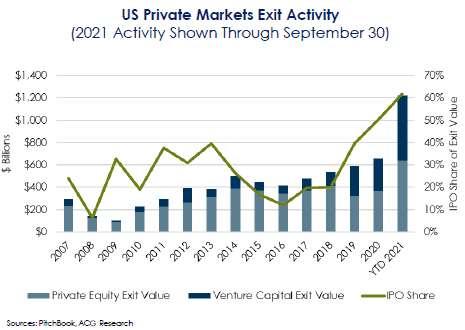
Strong returns resulted in significant liquidity for investors. Both private equity (PE) and venture capital (VC) exit value more than doubled in 2021, with the dominant theme being public listings. IPOs accounted for 45% and 88% of PE and VC exit value through 3Q 2021, versus an average of 16% and 52%, respectively, during the prior 5 years. That said, according to Renaissance Capital, the average IPO in 2021 finished the year down 8% from its offer price. While softness in performance could cause activity to slow, the IPO market is still positioned for another strong year in 2022.
In a robust market like today, it is important to remember that relative strategy returns can vary meaningfully over time. For instance, VC has been the best performing private markets strategy in 7 of the last 10 vintage years. However, it was one of the lowest performing strategies for most of the early and mid-2000s. Investors should continue to prioritize strategy diversification and avoid trying to time the market.
Global Real Assets
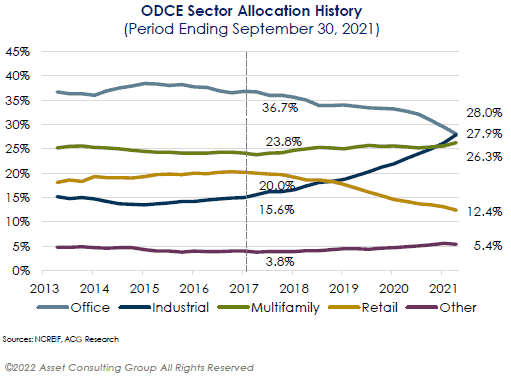
Following a rocky 2020, real estate has experienced one of its strongest years in recent memory. Through September 2021, the NCREIF ODCE had delivered a 13.2%gross return for the year, driven by a record 6.6% quarterly return in Q3. With even stronger Q4 estimates rolling in, the index could potentially finish the year with yet another record setting quarter, and potentially the highest annual return in its 44-year history. US real estate far outpaced the international markets due to a stronger domestic economic recovery, higher rent growth, and a higher allocation to non-traditional property types, like Self-Storage and Single-Family Rentals, which have benefited from the global pandemic.
While diversified real estate performance was decisively strong for the year, the market continued its K-shaped recovery with some sectors performing far better than others. Industrial has been the clear winner as supply constraints across the US have created historic rent growth, helping the sector deliver nearly a 50% return for the year. Multifamily also contributed meaningfully to performance, with fundamentals supported by a strong rebound in occupancy and a shortage of available housing. Retail and Office continue their uphill battle against the uncertainty created by e-commerce and remote work brought on by COVID-19.
The Bloomberg Commodity Index (BCOM) was up 27.1% for 2021, outperforming the BloomBar US Aggregate Bond Index, the S&P 500, and the MSCI ACWI. Energy delivered the strongest returns in the index, with crude oil averaging $70/barrel for the year. The only negative sector for the year was Precious Metals, as Gold, which is often viewed as an inflation hedge, delivered a surprising -4.3% for 2021.
Global Fixed Income Update
Global Traditional Bond Markets
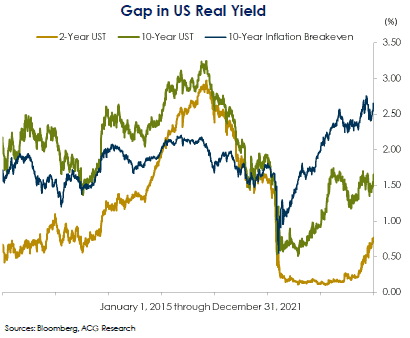
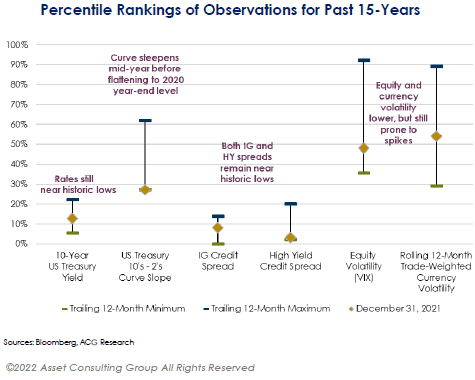
US monetary policy remained broadly accommodative throughout 2021 as the FOMC chose to keep the Fed Funds Rate within a target range of 0-0.25%. The US 10-year Treasury yield peaked at 1.74% at the end of Q1 before retreating to lower levels for the remainder of the year, reversing the yield curve steepening that had carried through 2020 and the first part of 2021. High levels of inflation turned investor attention toward Fed tapering in the latter part of the year, and the Fed eventually announced a tapering plan in November. The Fed subsequently announced a doubling in the rate of taper at its December meeting as the FOMC increased its inflation expectations and ceased describing inflation as transitory. Investor expectations of additional Fed tightening in 2022 and beyond led to an increase in yields approaching year-end 2021.
Credit spreads continued to tighten in 2021, primarily in the first half of the year, while the second half saw greater volatility arising from concerns over surges in new Covid variants and the potential impact of higher corporate borrowing costs. The BloomBar US Aggregate index declined 1.54% during the year. In contrast, the less duration-sensitive BloomBar High Yield index generated a gain of 5.28% for the year. High yield defaults hit extremely low levels in 2021, dropping to 0.5% by December.
Municipal bonds gained overall, with the BloomBar Municipal Bond index up 1.52% in 2021. The strong US dollar weighed on global bond returns as the FTSE WGBI – Unhedged index declined 6.97% and the JPM GBI EM Global Diversified index dropped 8.75%.
Global Nontraditional Fixed Income
Amid transitioning opportunity sets throughout 2021, Unconstrained strategies within our peer group produced an average return of 0.85% for the year. Given the lower duration exposure than traditional fixed income strategies, the category avoided the worst of the first quarter’s rate-induced volatility. Managers were rewarded for maintaining a risk-on posture throughout the year amid tight spreads and uncertainty on rates. Those who maintained or switched to defensive positioning on rates or credit often lagged or stumbled. With the market now keenly focused on central bank policy amid rapidly changing economic conditions, managers will be challenged to adapt to new circumstances and implement ideas quickly. The Unconstrained category is expected to continue to offer more muted downside risk in the context of rising interest rate expectations compared with traditional core fixed income strategies.
Long/Short Credit strategies capitalized on favorable market conditions in 2021, with many strategies generating double-digit returns amid continued economic recovery. Covid recovery stories continued to dominate portfolios during the first part of the year, but managers reported shifting out of some of these positions in the latter half of the year as themes played out. Event-driven strategies performed very well, as indicated by the HFRI Event Driven index, which was up more than 13% for the year. This performance occurred on top of strong gains in 2020 and despite a distressed cycle that never really materialized the way market participants had hoped. Relative value strategies in securitized and corporate credit also delivered solid gains for the year.
Private Credit (typically a five- to ten-year fund life) still offers an attractive yield premium versus public credit strategies, as spreads for leveraged loans and high yield bonds have continued to compress. Smaller private loans also routinely have full covenants, versus the public loan market which is now 90%+ cov-lite.
Disclosures
he views expressed herein are those of Asset Consulting Group (ACG). They are subject to change at any time. These views do not necessarily reflect the opinions of any other firm.
This report was prepared by ACG for you at your request. Although the information presented herein has been obtained from and is based upon sources ACG believes to be reliable, no representation or warranty, express or implied, is made as to the accuracy or completeness of that information. Accordingly, ACG does not itself endorse or guarantee, and does not itself assume liability whatsoever for, the accuracy or reliability of any third-party data or the financial information contained herein.
Certain information herein constitutes forward-looking statements, which can be identified by the use of terms such as “may”, “will”, “expect”, “anticipate”, “project”, “estimate”, or any variations thereof. As a result of various uncertainties and actual events, including those discussed herein, actual results or performance of a particular investment strategy may differ materially from those reflected or contemplated in such forward-looking statements. As a result, you should not rely on such forward-looking statements in making investment decisions. ACG has no duty to update or amend such forward-looking statements.
The information presented herein is for informational purposes only and is not intended as an offer to sell or the solicitation of an offer to purchase a security.
Please be aware that there are inherent limitations to all financial models, including Monte Carlo Simulations. Monte Carlo Simulations are a tool used to analyze a range of possible outcomes and assist in making educated asset allocation decisions. Monte Carlo Simulations cannot predict the future or eliminate investment risk. The output of the Monte Carlo Simulation is based on ACG’s capital market assumptions that are derived from proprietary models based upon well-recognized financial principles and reasonable estimates about relevant future market conditions. Capital market assumptions based on other models or different estimates may yield different results. ACG expressly disclaims any responsibility for (i) the accuracy of the simulated probability distributions or the assumptions used in deriving the probability distributions,(ii) any errors or omissions in computing or disseminating the probability distributions and (iii) and any reliance on or uses to which the probability distributions are put.
The projections or other information generated by ACG regarding the likelihood of various investment outcomes are hypothetical in nature, do not reflect actual investment results and are not guarantees of future results. Judgments and approximations are a necessary and integral part of constructing projected returns. Any estimate of what could have been an investment strategy’s performance is likely to differ from what the strategy would actually have yielded had it been in existence during the relevant period. The source and use of data and the arithmetic operations used for calculating projected returns may be incorrect, inappropriate, flawed or otherwise deficient.
Past performance is not indicative of future results. Given the inherent volatility of the securities markets, you should not assume that your investments will experience returns comparable to those shown in the analysis contained in this report. For example, market and economic conditions may change in the future producing materially different results than those shown included in the analysis contained in this report. Any comparison to an index is for comparative purposes only. An investment cannot be made directly into an index. Indices are unmanaged and do not reflect the deduction of advisory fees.
This report is distributed with the understanding that it is not rendering accounting, legal or tax advice. Please consult your legal or tax advisor concerning such matters. No assurance can be given that the investment objectives described herein will be achieved and investment results may vary substantially on a quarterly, annual, or other periodic basis. There is no representation or warranty as to the current accuracy of, nor liability for, decisions based on such information.
© 2022 Asset Consulting Group. All Rights Reserved. Asset Consulting Group is the sole owner of all rights, title, and interest to the materials, methodologies, techniques, and processes set forth herein, including any and all intellectual property rights. No part of this document may be reproduced, stored, or transmitted by any means without the express written consent of Asset Consulting Group.
Gryphon Financial Partners shall not in any way be liable for claims and make no expressed or implied representations or warranties as to their accuracy or completeness or for statements or errors contained in or omissions from them. This was created for informational purposes only. Gryphon Financial Partners, LLC is an Investment Adviser.